Employee Retention in 2026: What the Numbers Mean for UK Managers
25 June 2026
Employee Retention in 2026: What the Numbers Mean for UK Managers
The Scale of the Problem
Employee retention has become the defining people management challenge of 2026. The UK average turnover rate now stands at 34% — meaning more than one in three employees leaves their employer each year. Replacing each one costs an average of £30,614, according to Oxford Economics research. Three departures in a year could quietly cost a business more than £90,000 before anyone’s added up the total.
For managers, these aren’t abstract HR statistics. They represent real disruption to team performance, real pressure on the people left behind, and real costs that reduce what’s available for everything else. Thirty-six per cent of HR teams now cite hiring and retention as their single greatest challenge. The question isn’t whether this matters — it clearly does. The question is what managers can actually do about it.
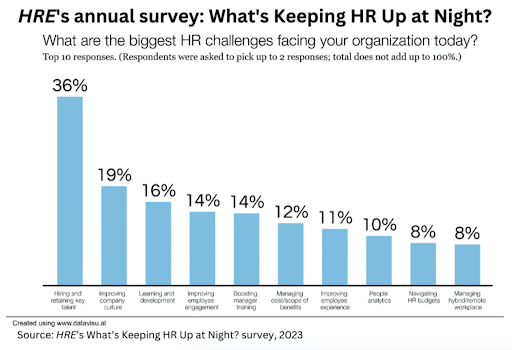
Image source: HR Executive
Why Employees Are Leaving
The reasons for leaving in 2026 are consistent across research and sector. Pay, recognition, and career progression account for the majority of departures — but the picture is more nuanced than any single factor suggests.
Feeling undervalued
A quarter of UK employees report feeling undervalued in their roles. More than half of that group plan to quit within the next 12 months unless recognition and rewards improve. This is a significant finding — because feeling undervalued is largely a management problem, not a pay problem. It reflects how people experience their daily working environment: whether their contributions are noticed, whether their manager takes their development seriously, and whether the organisation communicates that it sees them as a person rather than a resource.
Pay and financial pressure
As the cost of living continues to rise, pay has become a more acute driver of turnover. 36% of employees now cite inadequate pay as their top reason for leaving. Some of this pressure falls outside a line manager’s direct control. But how an organisation communicates about pay — whether people understand how salaries are set, whether pay reviews are transparent and fair — is significantly influenced by management culture. The organisations with the strongest retention records tend to be those where people feel the process is honest, even when the outcome isn’t what they hoped for.
Low job satisfaction and burnout
22% of UK employees report not enjoying their roles, and more than a third feel burnt out. These are connected: burnout erodes the engagement that makes work feel worthwhile, and disengagement accelerates burnout by removing the sense of purpose that makes demands feel manageable. Quiet quitting — the pattern of doing the minimum required without actively leaving — is the visible symptom of an employee who has given up on the job while remaining nominally in post. The productivity cost of this is significant: poor engagement costs the UK economy an estimated £257 billion a year in lost productivity.
What the Attrition Numbers Really Mean
UK attrition rose to 19% in 2025, above the European average of 17.4%. But the headline turnover rate only captures the people who actually leave. The proportion of employees who are disengaged but still present is considerably higher — and their impact on team performance, morale, and the workload of engaged colleagues is real and often underestimated.
When turnover is high, the people who remain carry more. Workloads increase. Institutional knowledge walks out the door. Hiring drives consume management time. The cumulative effect on team culture can be severe — particularly in smaller teams where a single departure shifts the dynamic for everyone.
Culture Amp’s analysis of 10 million employee responses found that leadership quality is one of the strongest predictors of whether employees choose to stay. With a great manager and leader in place, employees’ commitment to stay is 94%; a poor manager with a poor leader reduces that figure to 19%. That gap is one of the most striking statistics in the retention literature — and it puts the responsibility for retention squarely where it belongs: with the people leading teams day to day.
What Managers Can Do
Effective employee retention starts with understanding which employees are most at risk and why. A structured approach helps here.
Mapping your talent
The 9-box grid is a practical tool for this. Plot each team member by current performance on one axis and future potential on the other. The result is a clear visual map of who is performing above expectations, who is at risk of disengagement, and where development investment will generate the greatest return. Low performance scores — particularly when combined with changes in behaviour, increased absenteeism, or reduced willingness to engage — often indicate an employee who is quietly considering leaving. Identifying these signals early creates an opportunity to intervene before the decision is made.
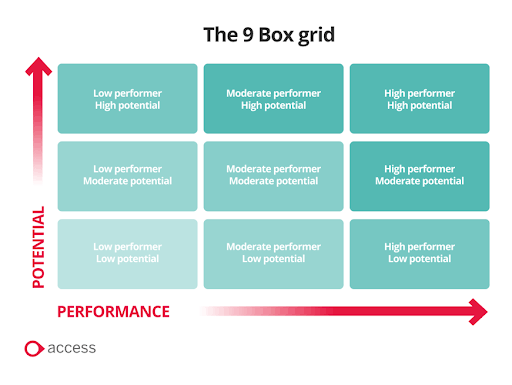
Image Source: The Access Group
Tailoring your response
Broad retention initiatives — wellness workshops, company-wide benefits packages, annual engagement surveys — have their place. But they rarely address the specific reasons a particular individual is disengaged. The most effective retention conversations happen one to one. They ask what’s working, what isn’t, and what would make the role more sustainable and meaningful for that person specifically.
Personalised benefits for disengaged employees — flexible working arrangements, access to mental health support, tailored development pathways — consistently outperform generic perks precisely because they address real needs rather than assumed ones. As the cost-of-living crisis continues to affect household finances, benefits that provide genuine financial security carry particular weight. Good motivation and team management practice starts with this kind of individual-level understanding rather than organisation-wide assumptions.
The role of recognition
Recognition is one of the cheapest and most effective retention tools available — yet most UK employees don’t receive it consistently enough to make a difference. This isn’t about formal reward schemes. It’s about whether managers regularly acknowledge effort, give specific positive feedback, and make people feel that their contribution is genuinely noticed. A team member who feels invisible is already halfway out the door, regardless of their salary. Making recognition a consistent management habit, rather than a sporadic response to exceptional performance, changes the daily experience of work in ways that matter to retention.
The Three Rs Worth Building Around
The most effective retention strategies share a common logic: respect, recognition, and reward. Respect means treating people as capable adults whose views and experiences matter. Recognition means making contributions visible — specifically and regularly. Reward means ensuring that compensation, development opportunities, and working conditions reflect the value people bring.
None of these require a large budget. Most of what drives retention sits within the daily behaviour of managers: how feedback is given, how development conversations are held, how workload is managed, and how much autonomy people feel they have over their work. The Knowledge Hub on leadership and managing performance covers the management practices most strongly associated with engaged, committed teams — directly relevant to any manager working on retention in 2026.
Further Reading
- CIPD: Employee Turnover and Retention Factsheet — The most authoritative UK source on turnover metrics, retention strategy, and what the evidence says about why people leave and what keeps them. Updated February 2026. Read the factsheet
- NatWest Mentor: Staff Turnover Rates by Industry UK 2026 Benchmarks — Detailed sector-by-sector turnover data with practical commentary on what the figures mean for retention planning in different industries. Read the article
- Stribe: Employee Retention Statistics UK 2026 — A well-sourced roundup of current UK retention data, including cost of turnover, sector benchmarks, and the most common reasons employees give for leaving. Read the article
Header image by: Mohamed Hassan from Pixabay
Disclaimer
The content on this site is provided for general information and educational purposes only. It reflects the author’s views and experience and is not intended as professional HR, legal, or employment advice. Every organisation is different, and readers should use their own judgement and seek appropriate professional guidance before making retention or HR decisions based on anything published here. The Happy Manager and Apex Leadership Ltd accept no liability for actions taken in reliance on the content of this article.
References
- Stribe (2026). 20 Employee Retention Statistics and Figures 2026 (UK). https://stribehq.com/resources/employee-retention-statistics-uk/
- Perkbox / Pressat (2026). The Great Value Exodus: Over Half of Undervalued UK Workers Plan to Quit in 2026. https://pressat.co.uk/releases/the-great-value-exodus
- Human Resources Online (2026). 5 Reasons Why Employees Leave Their Jobs: 2026 Workforce Insights. https://www.humanresourcesonline.net/5-reasons-why-employees-leave-their-jobs-2026-workforce-insights
- Ciphr (2026). A Snapshot of UK Employees in 2026. https://www.ciphr.com/infographics/a-snapshot-of-uk-employees-in-2026
- NatWest Mentor (2026). Staff Turnover Rates by Industry UK: 2026 Benchmarks. https://www.natwestmentor.co.uk/news/staff-turnover-rates-by-industry-uk-2026-benchmarks
- MOL Learn (2026). Key UK Employee Statistics 2026. (Culture Amp data on leadership and commitment to stay.) https://www.mollearn.com/about/news/key-uk-employee-statistics-2026/
Leadership Resources
 For more leadership resources look at our great-value guides. These include some excellent tools to help your personal development plan. The best-value approach is to buy our Leadership bundle, available from the store.
We’ve bundled together these five e-guides at half the normal price! Read the guides in this order, and use the tools in each, and you’ll be well on your way to achieving your personal development plan. (6 guides, 167 pages, 27 tools and 22 insights, for half price!)
- Leadership Essentials
- Defining Leadership
- Leading Insights
- Leading with Style and Focus
- Transformational Change
- Making Change Personal
Blog Content: Most blog pages on this site are from sponsored or guest contributors. Although we may receive payment for these, all posts are vetted to ensure they meet our editorial standards and offer value for our readers.
>> Return to the Leadership Knowledge Hub